You have implemented a consent tool or CMP (Consent Management Platform) such as Didomi, Axeptio or others, following the GDRP (General Data Protection Regulation) regulations, and you would like to explain its impact on your analysis…
Ouch. It’s complicated ?… Between interaction rate, acceptance rate, Traffic, bounce conversion… There are a lot of indicators, coming from different sources, that have all been turned upside down and that we sometimes have a hard time reconciling.
Don’t panic, after reading this article, you will know how to quantify the impact of each of the changes on your real business in a simple and visual way.
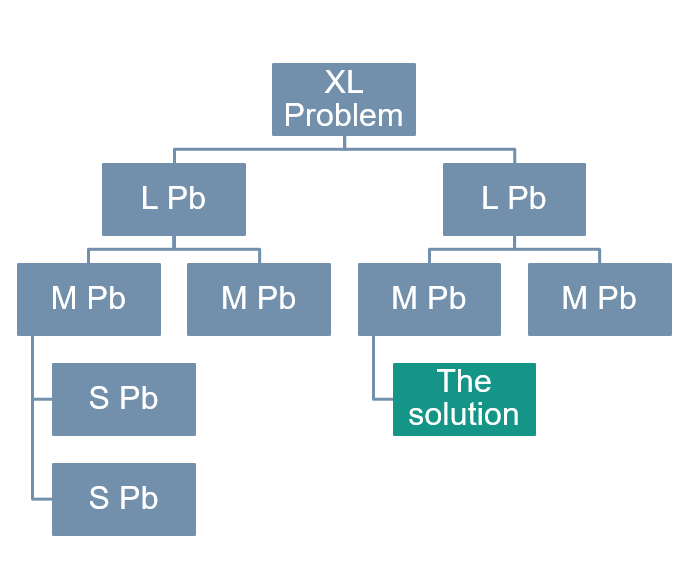
Let’s discover together how Datama breaks down the problem and summarizes it in one slide.
1. Building its market equation
The « market equation » is an analytical approach which allows you to mathematically link indicators together. In problem solving, it is a precious tool to avoid getting lost in useless indicators and to focus immediately on the origin of a problem.
In this case, we are going to link the indicators coming from the CMP, the analytics tool and the ERP to understand the performance of your website in a comprehensive way.
Performance in the CMP
Your CMP is there to collect the consent (or not!) of your users in the use of your various cookies and tracking/personalization tools.
The CMP management interface gives you access to certain performance statistics in a more or less aggregated way. Generally, these include the number of users who arrive on the site, their interaction rate with the cookie management banner (this parameter only comes into play when the banner does not block the user’s browsing) and its acceptance rate (which is sometimes broken down into partial or complete acceptances. If we were to define a global indicator of the performance of your CMP, we would probably have an acceptance rate that would be the product of the two previous rates:

The overall acceptance rate would thus be the performance indicator for your CMP.
From CMP to the Analytics tool :
In your Analytics tool (Google Analytics for example), you will find the sessions of users who have accepted cookies via your CMP tool. The consent rate is determined as the ratio of Google Analytics (GA) sessions to those initially identified by your CMP:

To compare it with the previous year’s period, as long as we do not have a history with the use of a consent tool, we must take a global consent rate equal to 100%. Indeed, in the absence of a CMP, all sessions are tracked. When we compare two periods with the CMP tool, we can study the variations in the global consent rate.
Performance in the Analytics tool :
Let’s take the example of a merchant site. Your online performance can be measured by the revenue generated on your site. This is your main KPI. But it is usually broken down into sub-indicators:
Taking a very simplified conversion tunnel in our example with the number of sessions that do not bounce, transactions and revenue generated which is the goal you are tracking, we can easily break down this main KPI as follows:

(The conversion tunnel can be adapted to your needs by breaking down the journey step by step, for example by looking at the rate of passage between step 1 and 2, then 2 to 3 …).
From the analytics tool to the to the ERP data
Of course, still following our example of a merchant site, the revenue observed in the tracking tool is not the one that is on our bank account at the end of the month.
Generally, the real revenue is measured in a tool that is closer to the real accounting, whether it comes from a CRM (Customer Relationship Management) tool or an ERP (Enterprise Resource Planning).

One can easily link the actual revenue generated to the GA revenue by creating an intermediate “overlay” indicator between the analytics revenue and the actual revenue.
Constitution of the market equation
By putting together the previous points, we can now write the market equation in its entirety, by attaching the different indicators we saw earlier:

2. Analyze performance
Generate dataset
The market equation seen above connects metrics that come from different data sources, and that are not necessarily compatible in the different dimensions of analysis (by country, market, device etc…).
We will therefore build a hybrid dataset, containing metrics and dimensions in a single table, by “pasting” the different sources under each other, and aggregating the data at the relevant level
As this kind of manipulation can be tedious, especially if you want to update them on a regular basis, Datama has developed a new module “Datama Prep” that allows you to combine different data sources in a simple and visual way. We then combine these last three steps in Datama Prep, we obtain the following data flow chart:

The CMP or ERP data can be taken from a Google Sheet or Excel depending on the possibilities offered by your tools. The dataset will then have the following form
 View source
Create the analysis
Now that we have the dataset and the market equation, we can very simply perform a comparative analysis of the performance in year N vs. N-1 in Datama.
We use the Datama Compare module and simply connect the dataset previously created
It is then possible to visualize the variation of each of these indicators in a waterfall graph and to realize their respective impact on the main KPI, here the real revenue in the ERP.
 In this case, we can clearly and succinctly present the results of the analysis: the short-term business impact is not negative on real revenues.
We break down the variations into 3 main effects:
1. We can clearly see the loss of tracked sessions which leads to a -65.7% drop in sessions due to the CMP tool
2. However, the loss of sessions actually filters out mostly sessions that have no interaction with the first page, which results in an improvement of the bounce rate and the conversion rate on Google Analytics.
3. The direct business impact is low because we can observe that the real sales are found in the gap between ERP and GA revenues.
We can then use the Datama Compare tool to analyze the variations on the different dimensions collected in the dataset, in order to improve the consent rate. Because it should be noted that if the short-term impact is not negative on the real business, the decrease of tracking in Google Analytics has an indirect impact on performance: the relevance of acquisition algorithms will be degraded, and our customer knowledge and the way to optimize the product in the long term will also suffer…
- Did you like this analysis?
- Do the same at home ? !
1. Create an account on our solution.
2. Adapt and upload the dataset used in this article